


Remote Debugging
In this tutorial we will see how to debug remotely java code which can be executing in a server which is not the machine in which we are executing Eclipse. We will see the process of debugging in eclipse and Tomcat server, with more detail. We will also see some concepts on development environment in companies.
Workstation and Host.
Workstation is the machine where the developer works and where eclipse is installed. A Host or Server is a machine where all the server applications are installed, as well as the SQL database servers, Web servers, etc. Normally, a developer works in his Workstation and when he has a stable version, he publish it(makes a deployment) in the Host, so that the clients, application users or testing teams, can see it.
Development environment, integration, pre-production and production.
The development environment is the sum of the hardware and software used by the developer to program. It can be composed by only the Workstation or it can include one or more Host servers. Sometimes, instead of using a Web server in our Workstation, we use a server to publish the application.
When the application is finished we install it, in one or more servers or Hosts, which are known as production environment. This installation will be the one used by the web application final users.
In big companies, there are intermediate environments known as integration, pre-production or testing, used to test the application before it goes to the environment production.
When is the remote debugging interesting?
When an application is installed on an integration or production server, it is normal that it communicates with other applications (Example.: SQL servers, web services, etc.). A lot of times this interaction can only be tested in the server. A lot of times the workstations use Windows and Linux servers.
Due to this, a lot of times we only find errors in our application when it is installed in the server, and not before in our Workstations, where it works correctly. Other times, it is not even possible to test certain funcionalities in the Workstation. In these cases, to be able to debug the application in the server, is very helpful.
How does the remote debugging work?
The java virtual machine can do this remote debugging. This facility is not limited to Tomcat and can be use with any program written in java.
The following graphic shows us a web application called app1, deployed on Tomcat, installed in a Host and debugged on an eclipse installed in a Workstation.
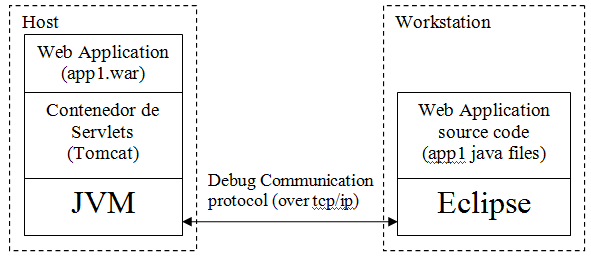
In Eclipse we find the source code of the application "app1", with the breakpoints where we want the debugger to stop. The JVM communicates with Eclipse using the tcp/ip protocol.
To start this diagram, we start Tomcat for the remote debugging indicating a tcp/ip port (for example:8000), where it will stay waiting till it connects with Eclipse. In Eclipse we start a remote debugging indicating the Host ip address and the indicated port (for example.:8000).
Debugging our example "first-jee"
The first thing we are going to do is to generate the file first-jee.war and copy it in the webapps directory of Tomcat (Right button of the mouse on the project - Export - WAR file ...). Once we have copied it, we need to start Tomcat in remote debugging.
The Servlet containers like Tomcat are java applications. If you remember from the last tutorials, we started the Tomcat with start.bat. When we executed start.bat, this executed setclasspath.bat and finally catalina.bat, which executed something like:
java -classpath "C:\apache-tomcat-6.0.33\bin\bootstrap.jar" org.apache.catalina.startup.Bootstrap
This instruction tells the JVM to execute the static main method of the class "Bootstrap", which is inside the file bootstrap.jar. The main method will start the server which will be waiting http requests in the 8080 port (by default).
We can inform the JVM that we want him to start in the remote debugging mode, including these options -Xdebug -Xrunjdwp:transport=dt_socket,address=8000,server=y,suspend=y
java -Xdebug -Xrunjdwp:transport=dt_socket,address=8000,server=y,suspend=y -classpath "C:\apache-tomcat-6.0.33\bin\bootstrap.jar" org.apache.catalina.startup.Bootstrap
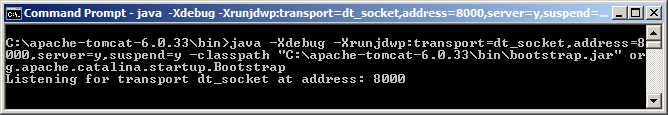
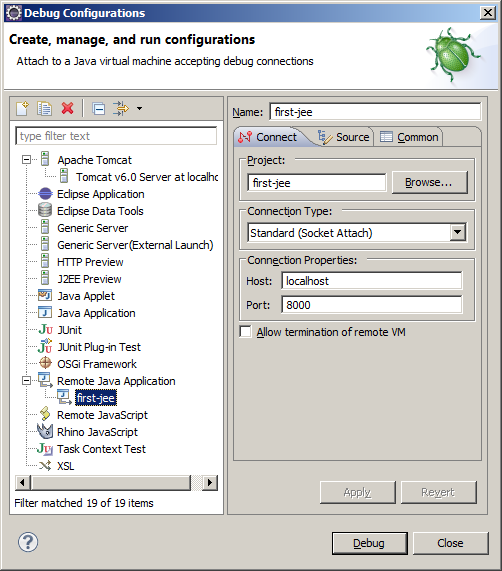
As we have indicated with "suspend=y", the JVM stays waiting for the connection of the debugger in the port 8080. To establish the connection in Eclipe we go to menú Run - Debug Configuration - Remote Java Application -new
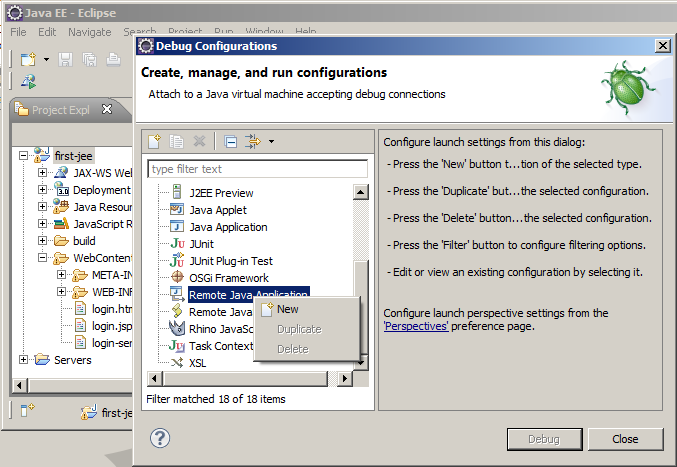
In "Project" we indicate the project which contains the source code of the application which we are going to debug. In "Host" we indicate the ip address of the Host where the server is (in this example I´m using the same machine so I will use localhost), in "port" we write the choosen port when we start the JVM (in our case 8000), and lastly we click on Debug.
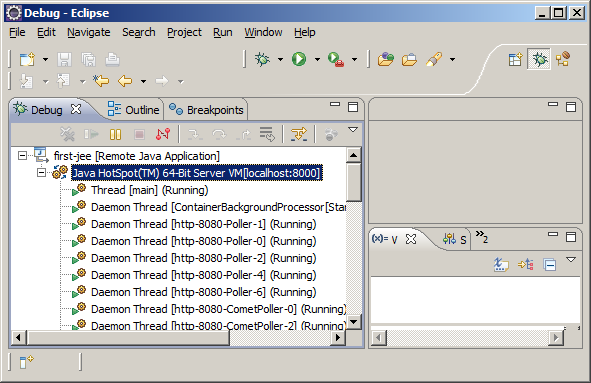
If we go to the debug perspective we will see the call stack which indicates [localhost:8000]
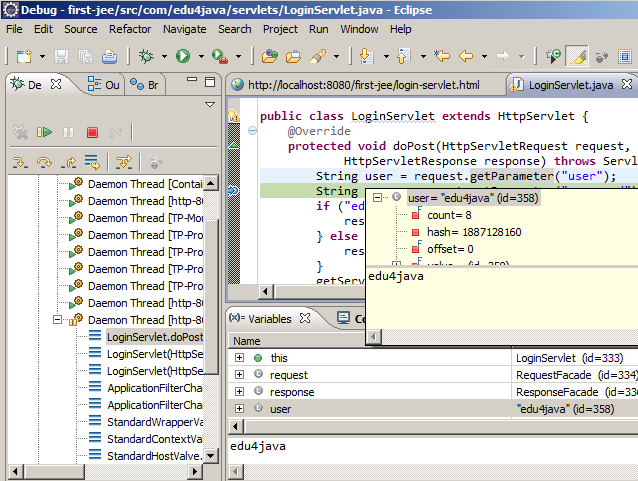
We check if we still have the breakpoint in LoginServlet.java, we open a browser in localhost:8080/first-jee/login-servlet.html and we click the button. In the debug perspective, we can see the execution interrupt in the same way as in the last tutorial.
Conclusion
It is important to highlight:
- The servlets containers (like Tomcat), are java applications which execute over a JVM.
- The debugging capacity is inherent to the JVM. We can debug remotely any java application.
| << Web application debugging | Index >> |