


How to debug a Java program with Eclipse
There are many cases where it is difficult to understand what happens in a program. The solution is to debug the code.
The Java virtual machine, has code debugging capabilities, even from a remote machine. Eclipse makes debugging simple.
What is debugging?
Debugging is a methodical process in which we go through all of the code, looking at the value of the variables of the program. This allows us to see exactly what is happening in our program when executing a specific line of code.
How to start?
First, we place a breakpoint in a line of code in our program. To create the breakpoint we double click on the left side of the window where we see the code.
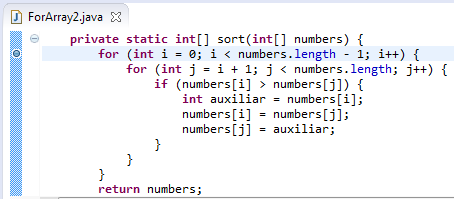
We will debug the sort method from the code of the previous tutorial:
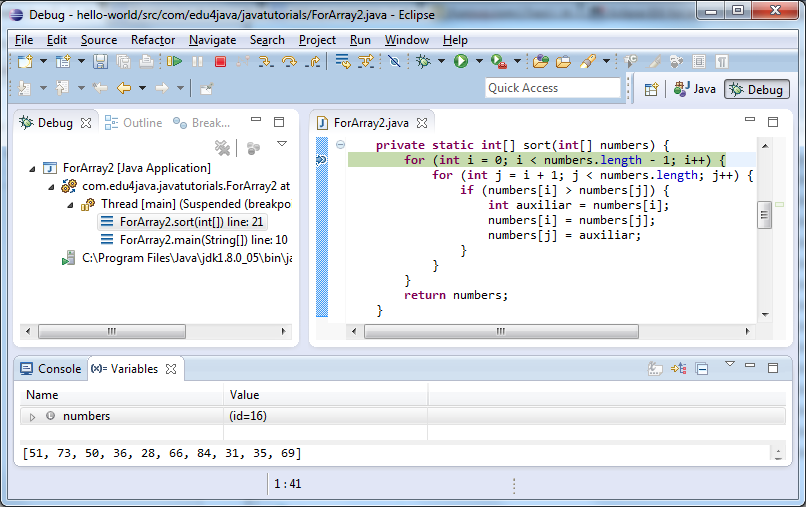
We start our program with the debug option. Our program will run normally until it finds the line with the breakpoint. Eclipse will stop the execution and request permission to switch to the Debug perspective. Click "Remember my decision" and "yes". Then the debug perspective with our marked line appears, showing information about the phase of the execution.
Debug perspective in Eclipse
Eclipse has several ways of showing our projects. These modes are called perspectives. Although we have not noticed, until now, we have been working in the Java perspective.
When we switch to the Debug perspective, the first impression is confusing because there are new views (windows) and they are in a different position than in the Java perspective. Since we are going to use the Debug perspective a lot, I advise you organize the tabs. We may modify their position, dragging and dropping the tabs.
In the top right corner, we can see the perspectives bar, with the Debug perspective selected. If we want to go back to the Java perspective, simply click in Java.
The new views of the debug perspective are Debug, Variables and Breakpoint. We can also see, that the Code View shows the line where the execution is stopped, marked in green.
Variables View
In this view we see a line for each variable, field, or parameter. If you click on each of them, we can see their contents.
Breakpoints View
Here we can see the list of all the breakpoints we have. You can enable or disable a breakpoint, with the check mark at the left side of each breakpoint.
Debug View
The debug view shows the list of applications that are running and the ones which ended their execution.
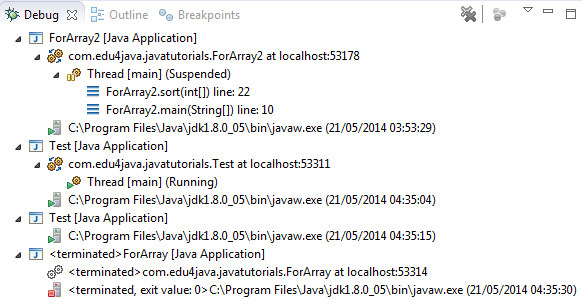
In the picture, we can see that the first three programs are running and the last one has finished. The first two, run in debug mode and you can see the thread of execution. The third is not in debug, so you can not see the thread.
The first has suspended execution at line 22, in the ForArray2 class sort method. We also see that it is being held in the main method, line 10 of the same class. This is what is known as execution stack.
The execution stack is composed of subsequent calls of a method within another method. At the base, we have the first method main from where the sort method was called.
Buttons to control debugging
In the main bar, next to the print buttons, we can see the buttons to handle the debugging.
![]()
The functions of these buttons, in order, are:
-
Resume (F8); continues with the execution (until the next breakpoint).
-
Suspend; we can stop the debugging even though we haven´t reached a breakpoint (useful when we enter an infinite loop).
-
Stop; stops debugging.
-
Step Into (F5); stops at the first line of the method we are executing. If there is no method, it works as Step Over.
-
Step Over (F6); it continues to the next line we see in the code view.
-
Step Return (F7); returns to the next line of the method that called the method that is currently being debugged. Or what is the same, it goes up one level in the execution stack, as we see in the Debug view.