


Web application debugging
In this tutorial we are going to see how to debug JSPs, Servlets and java code of our web application.
Steps to debug
In this tutorial we are going to debug the servlet LoginServlet.java and the JSP login.jsp, which are the ones we were working with in the last tutorial.
The first thing we are going to do is put breakpoints.
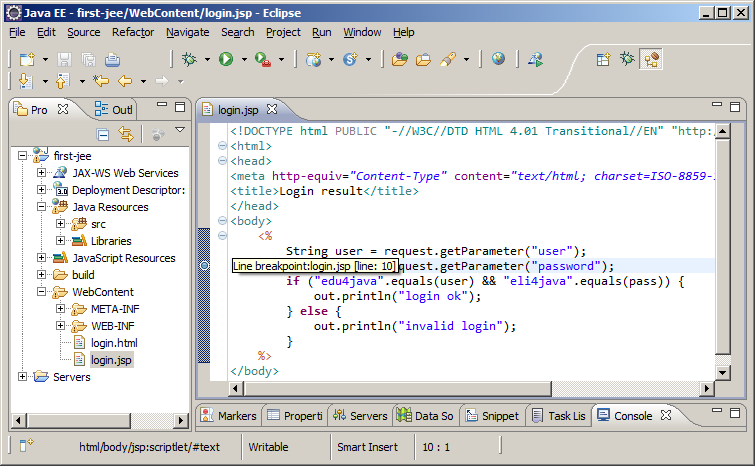
We open login.jsp and we double click on the left margin of the editor on the code line where we want to interrupt the execution of the application. If we double click again on the breakpoint, it disappears.
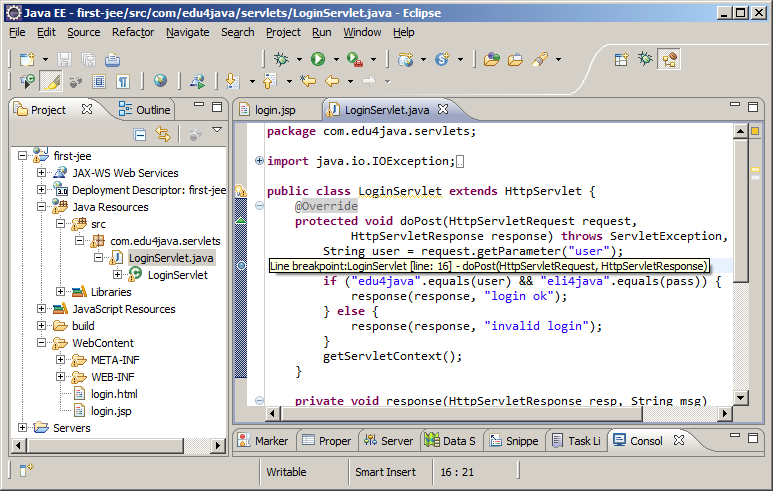
In a similar way we open LoginServlet.java and we double click on the left margin of the editor on the code line where we want to interrupt the execution of the servlet.
We start the Tomcat server in a Debug mode and we execute the application.
Right button of the mouse on login.html - Debug As - Debug on Server. This opens the browser in http://localhost:8080/first-jee/login.html.
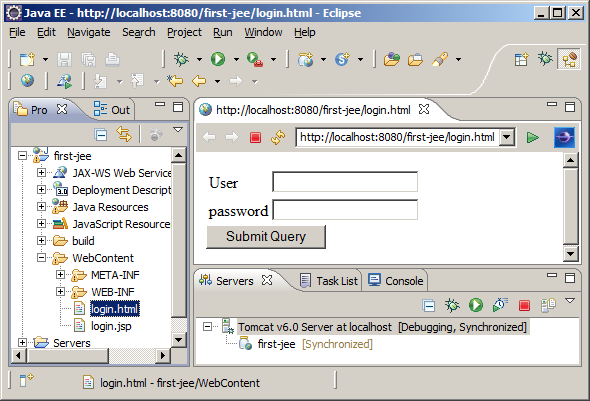
Unlike last executions, we can see in the Servers view, that on the right-hand side of Tomcat v6.0 at localhost; it says Debugging. If we now press the Submit Query button, we will see this;
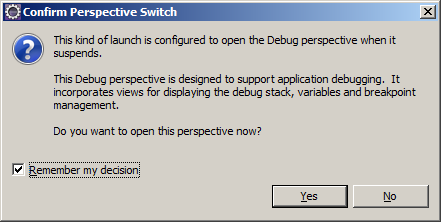
This window asks for the confirmation of the change of perspective to debug in eclipse. To avoid that this window appears each time me select "Remember my decision" and we click on "yes". After this we are going to see the Debug perspective (in the top right corner we can see a beetle). Don´t worry if you see the perspectives in a different way; it is because I have personalized this view dragging and dropping the views as I want them.
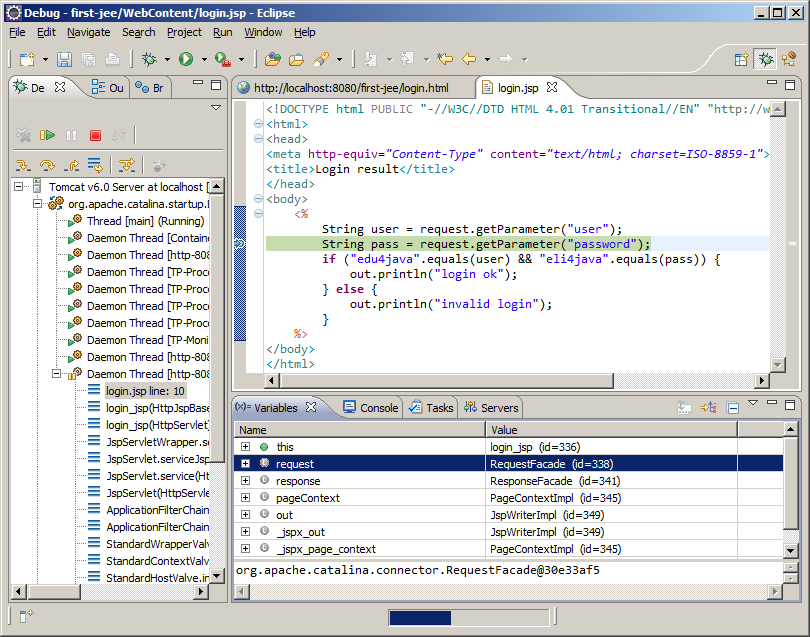
In the last image we can see the editor of login.jsp with a green line in the place where we put the breakpoint. This means that the execution is stopped in this line.
At the bottom, in the variables view, we can see the variables which exist at this moment of the execution and we can explore their content.
At the left, in the Debug view, we can see what is known as the call stack. Each line, indicated with a![]() is a thread of the server in execution and we can see that a thread is stopped in the line 10 of the login.jsp page.
is a thread of the server in execution and we can see that a thread is stopped in the line 10 of the login.jsp page.
We have to point out that the options of debug of a JSP are more limited that those of a .java file. To see this we are going to debug the servlet LoginServlet.java.
First we stop the current execution clicking on the red square in the Debug view and we go back to the JEE perspective clicking on the button which has a coffee grain in the top right corner in eclipse. Then we create a new page login-servlet.html with the following content
<html>
<body>
	<form action="login" method="post">
		<table>
			<tr>
				<td>User</td>
				<td><input name="user" /></td>
			</tr>
			<tr>
				<td>password</td>
				<td><input name="password" /></td>
			</tr>
		</table>
		<input type="submit" />
	</form>
</body>
</html>
This page is the same as login.jsp, but with the only difference that action points to login instead of login.jsp. We click the right button of the mouse on login-servlet.html, - Debug As - Debug on Server and the browser opens in http://localhost:8080/first-jee/login-servlet.html. Now we fill in "User" with edu4java and we click on Submit:
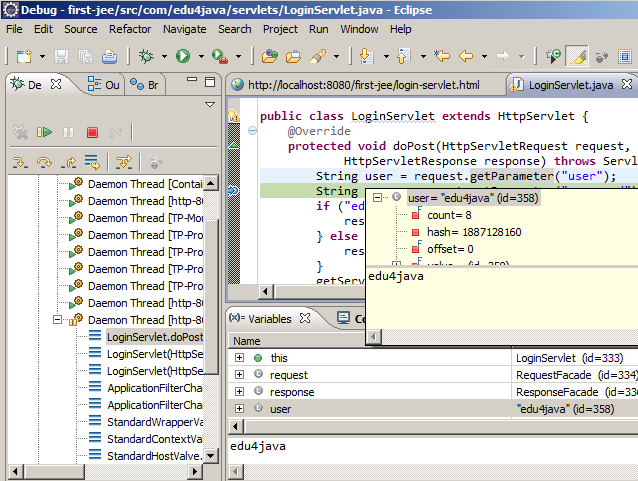
Here we can see that the execution has stopped in the breakpoint that we put in the servlet. If we put the pointer of the mouse on top of the variable "user" we can see that its content is "edu4java". This option doesn´t exist when we debug a JSP.
In the following tutorial we will see Remote Debugging
| << Introduction to Java Server Pages JSP | Remote Debugging >> |